DIVA Donate - Insights into Trigger Selection Methodology
By Walodja1987 at
TL;DR: This article sheds light on the methodology used to determine the donation release profiles for the ongoing parametric conditional donation campaign supporting pastoralists in Kenya.
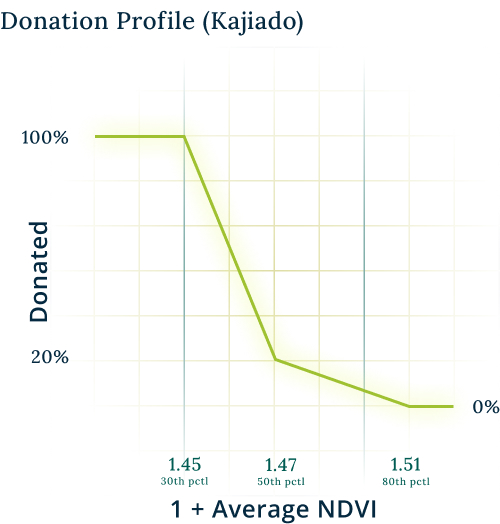
The current campaign with pastoralists in Kenya uses the following donation release profiles:
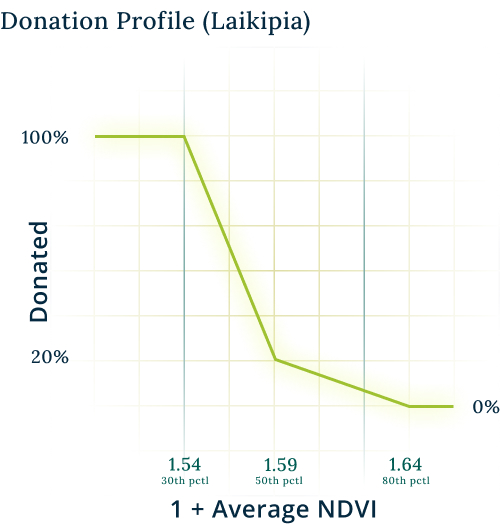
The reference metric is the average Normalized Difference Vegetation Index (NDVI) recorded during the period 1st October to 22nd December 2023, shifted by 1.
Let’s explore why this particular configuration was chosen.
Context
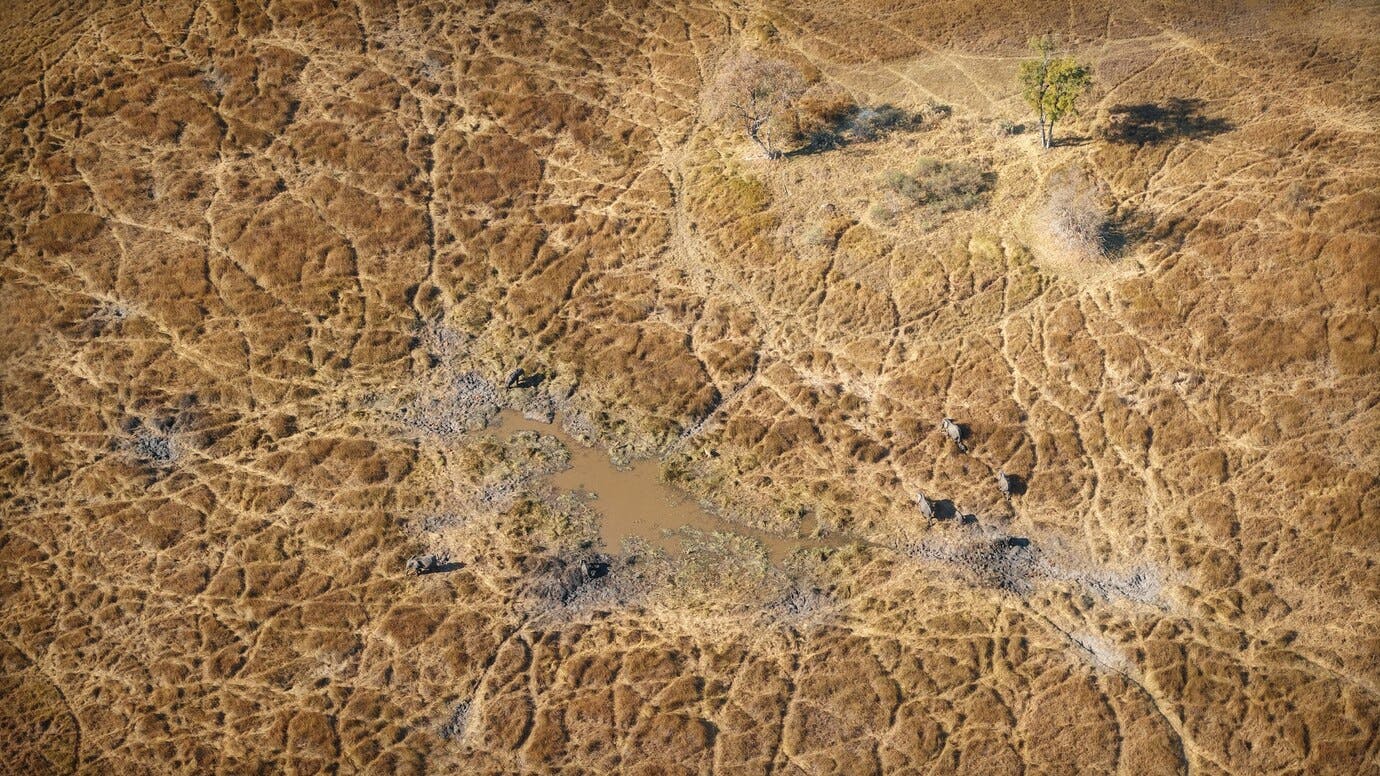
Kenya’s climate naturally fluctuates between rainy and dry seasons. Rainfall during the rainy season triggers vegetation growth, which provides necessary pasture for livestock in the coming dry season. However, over the last few years climate change has been reducing rainfall during these periods, intensifying challenges in the dry season, causing livestock losses and hunger, affecting millions of people.
Specifically, the years 2016, 2017 and 2022 were marked by severe droughts. Notably, the rainy season of 2022 (March - May) was recorded as the driest in over 40 years.
The goal of the conditional donation campaign is to time the release of funds just before the inception of the dry season when the rainfall amount during the rainy season is deemed insufficient.
Methodology
To achieve this goal, the following three steps were required:
- Determine a measure for drought
- Identify the rainy period
- Define the shape of the donation release profiles
Drought measure
The campaign uses the Normalized Difference Vegetation Index (NDVI) as a drought measure. The NDVI is sourced from satellite imagery and measures the density and health of vegetation in a given region, which closely mirrors rainfall quantity. Higher NDVI values indicate a greater density of healthy vegetation, while lower values indicate drought stress.
The available dataset spans 11 years (2012-2022), extracted from eVIIRs and provided by Shamba Network. Each NDVI data point represents a 5-day average, creating a dataset that is more resilient against cloud coverage which can prevent vegetation measurement.
Historical data analysis
When examining the historical NDVI data, a clear seasonality pattern emerges, as illustrated below for the two Kenyan counties involved:
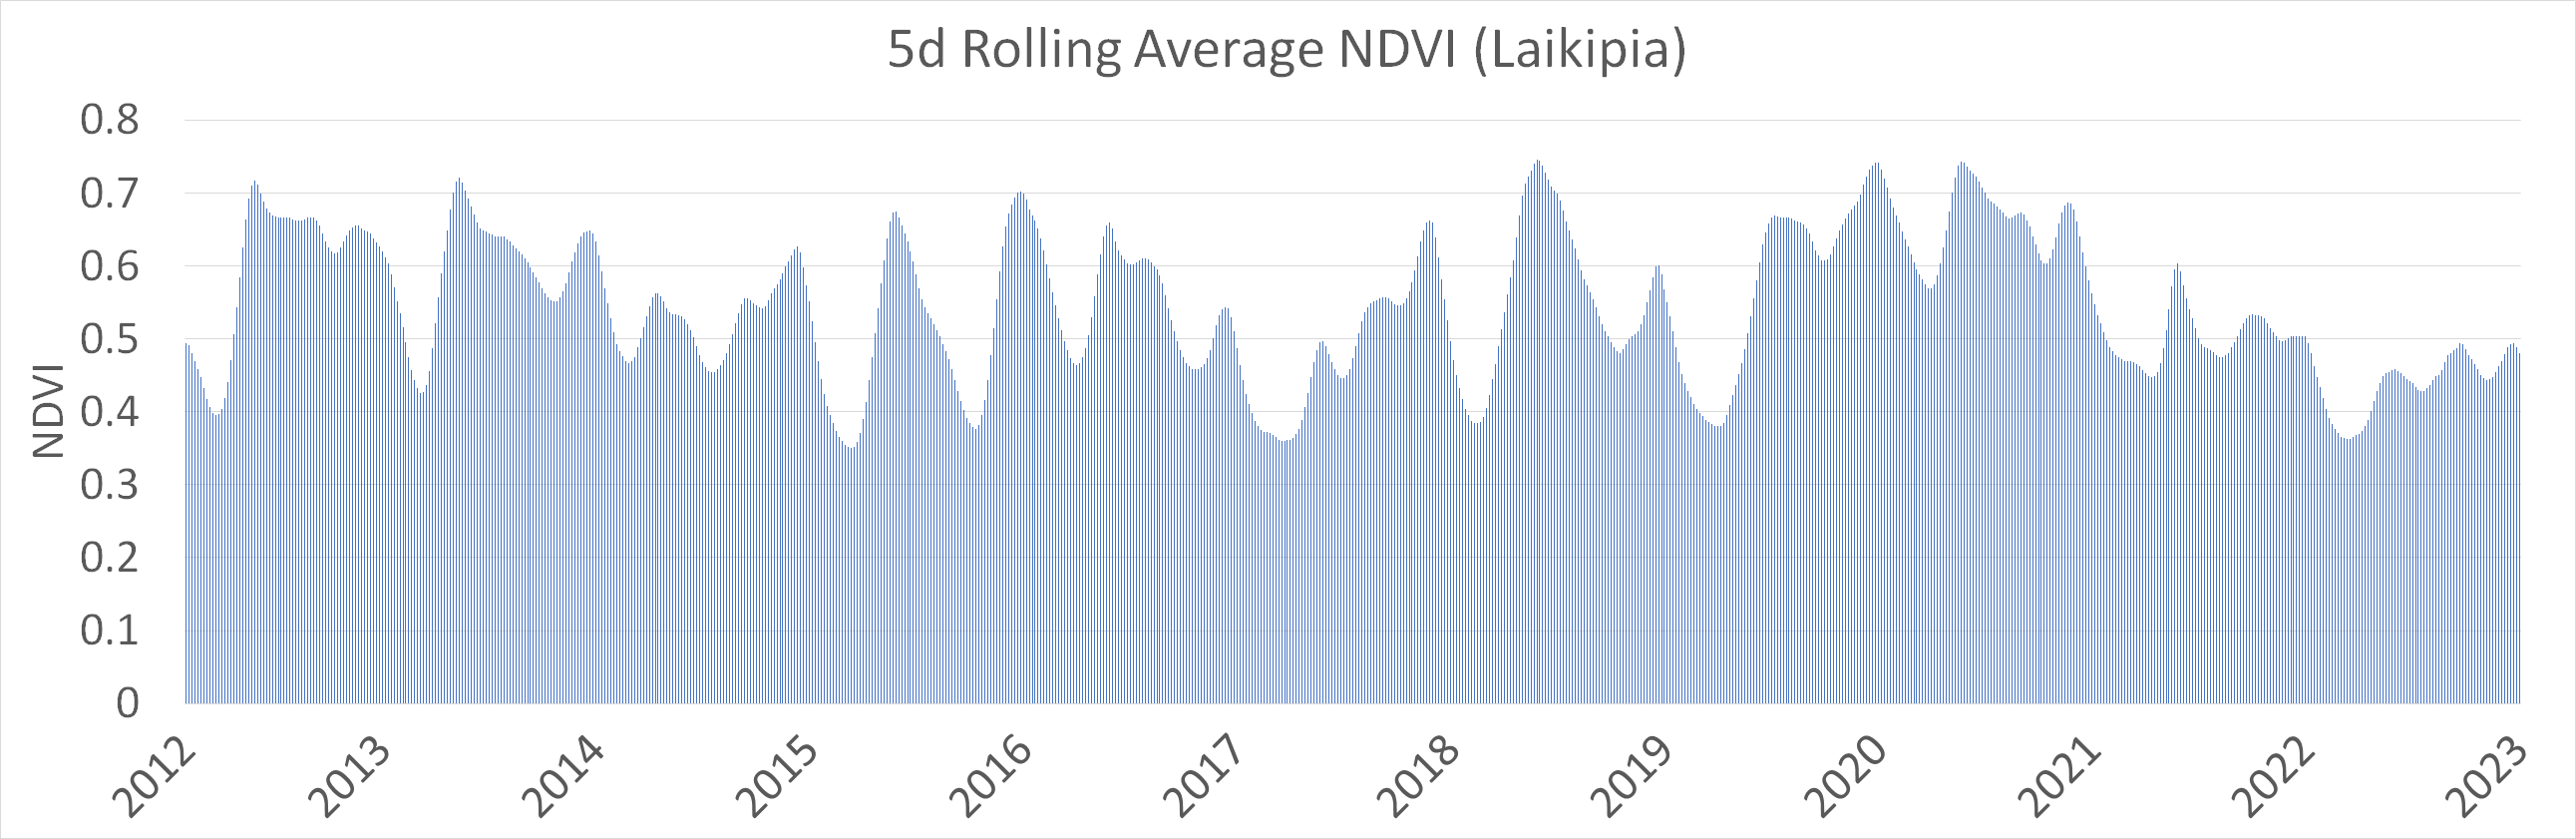
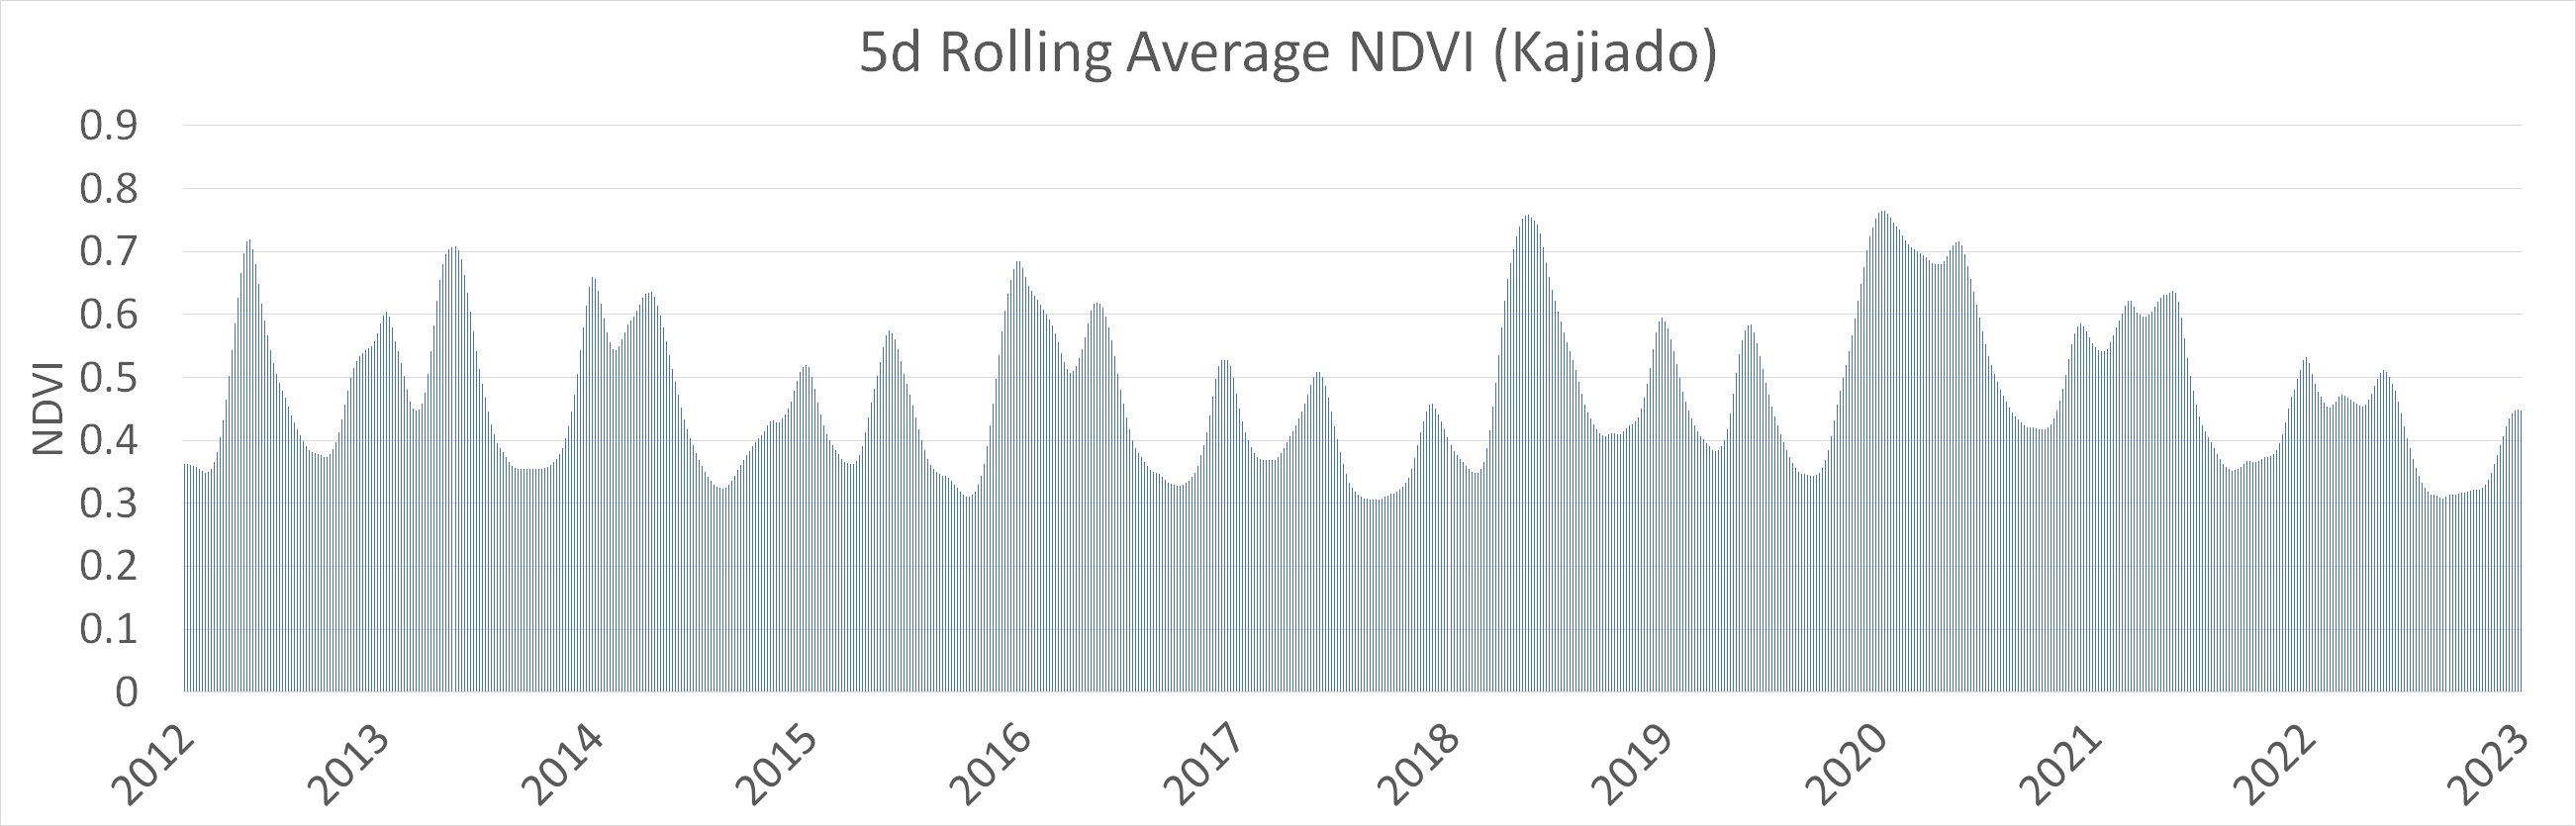
Local bottoms mark the end of dry periods and the start of rainy periods, while local tops indicate the end of rainy periods and the start of dry periods.
Specifically, there are two distinct rainy seasons during a year: one starting in March and another in October. This pattern becomes apparent when examining the data more closely, as illustrated in the following example for the years 2015-2017.
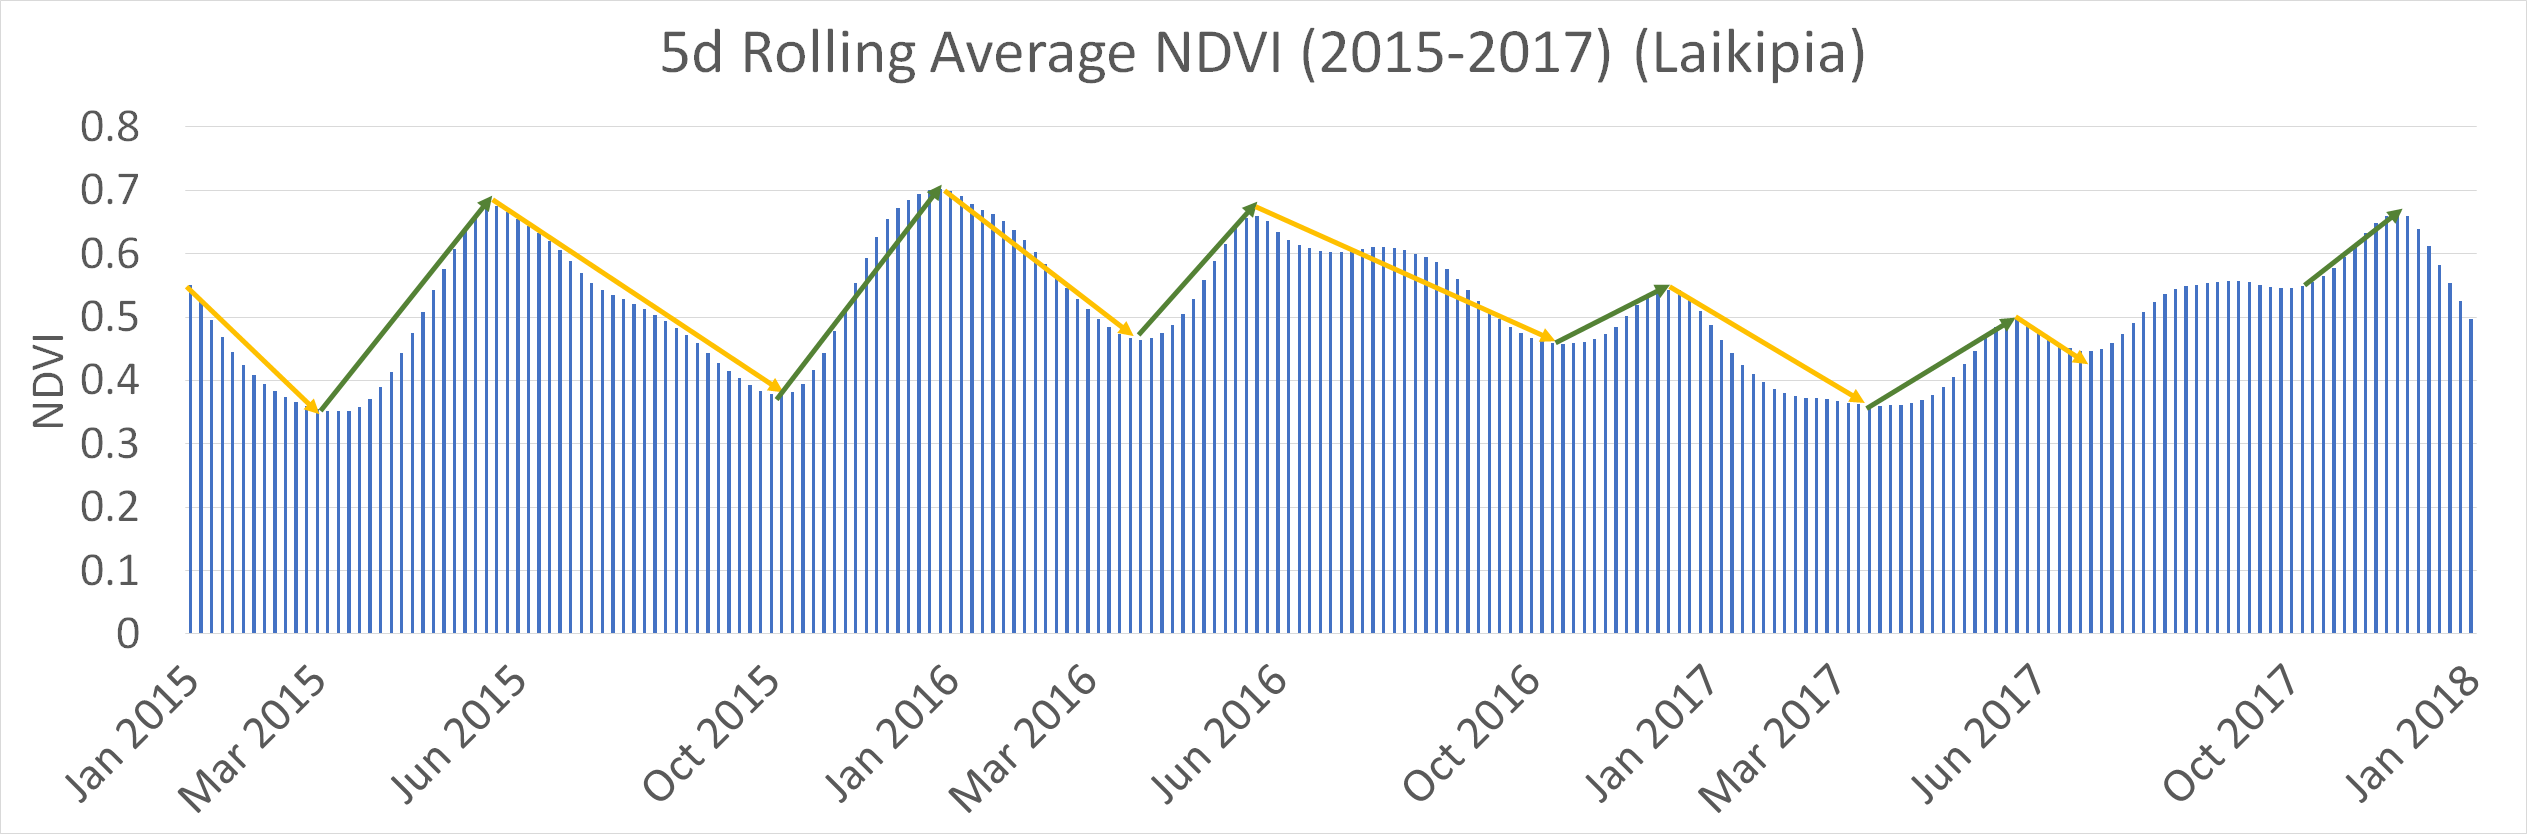
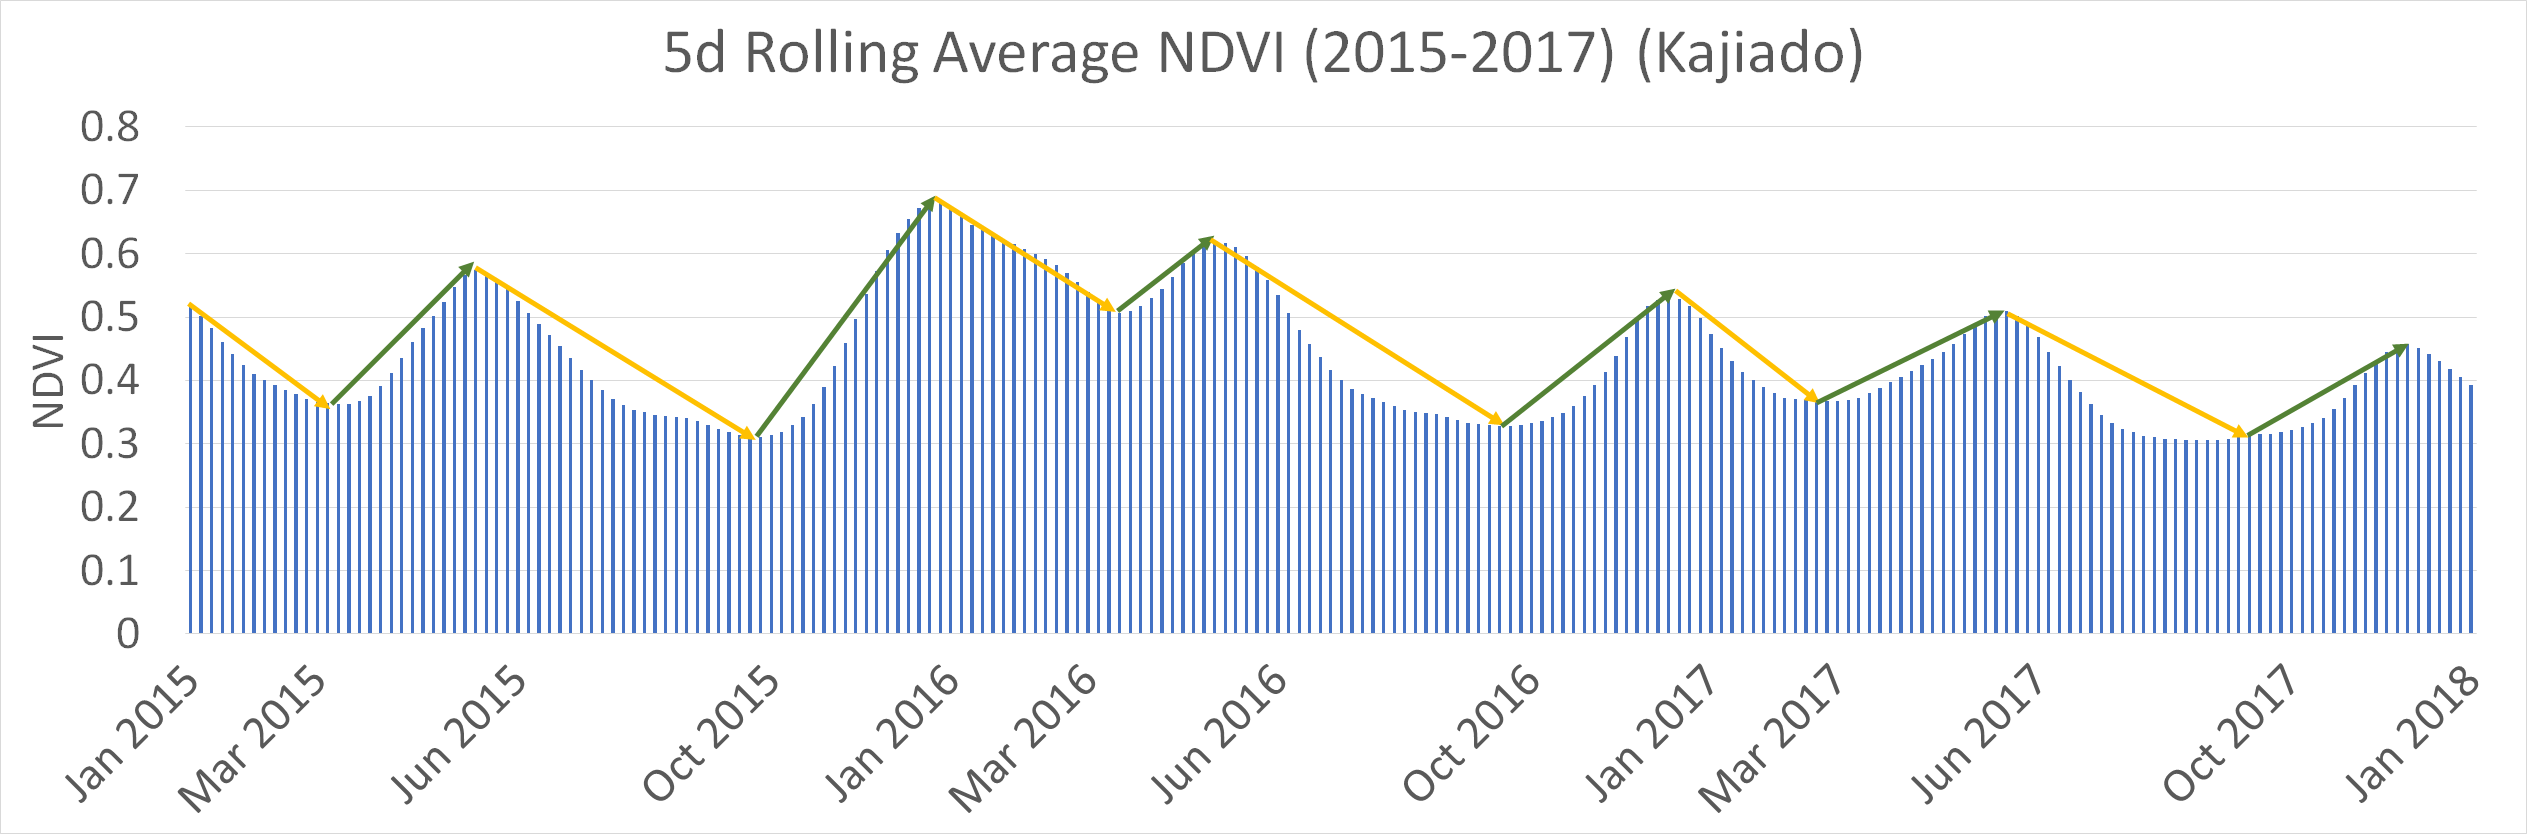
During these periods, the NDVI hits a local bottom (typically in March & October) and subsequently increases, indicating higher rainfall levels. The NDVI peaks at the end of May and December, respectively, signifying reduced rainfall thereafter. This consistent pattern holds true for both regions.
Observation Period
For the ongoing campaign, only the rainy season starting in October was considered. The historical NDVI data from August to January for both counties is plotted below:
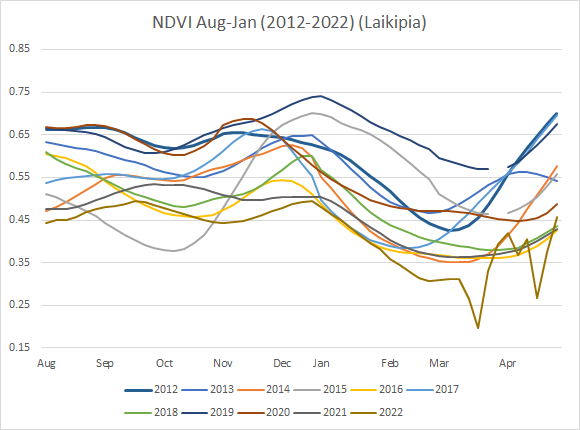
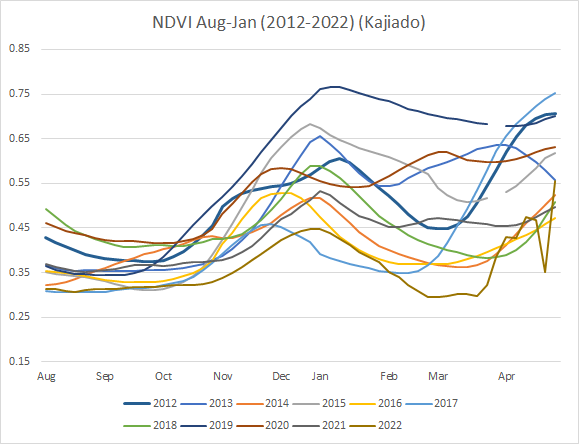
Based on local bottoms and tops visible in the charts, the observation period for the campaign was set from 1st October to 31st December 2023. Considering that no data is typically published between 22 and 31 December, the actual observation end date was set to 22th December. To mitigate the risk of delayed availability of the data, the outcome will be reported with a 10-day delay, on 2nd January 2024.
Reference asset
To trigger the donation release, the average NDVI value during the observation period is used. The use of the average as a summary statistic is suitable given the absence of outliers in the data.
The average NDVIs by year for the observation period 1st October to 31st December are plotted below. As can be seen, flatter curves observed in the previous images result in a lower average value.
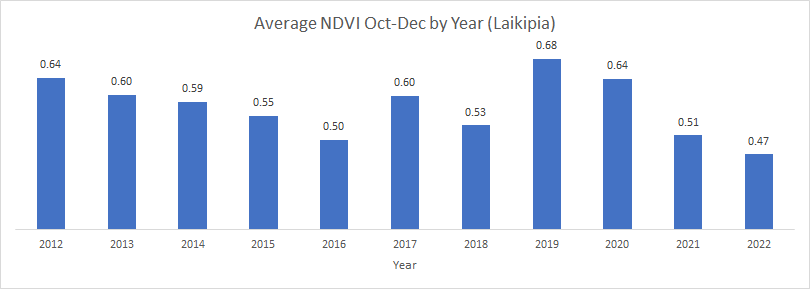
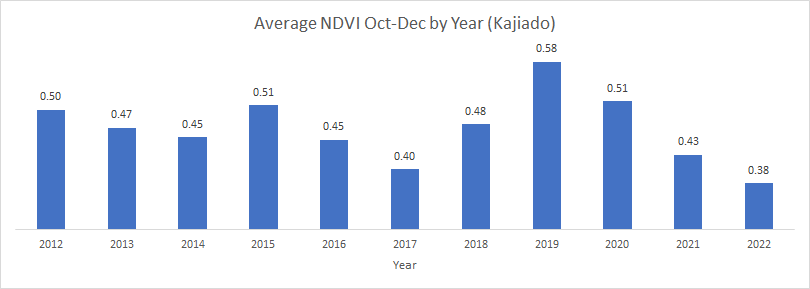
For both counties, the lows in the year 2022 align with the occurrence of a severe drought documented in the Horn of Africa. The 2016/2017 drought had a more pronounced impact on Kajiado compared to Laikipia.
Note: As the NDVI can go as low as -1, but the underlying smart contract cannot accommodate negative values, the average NDVI shifted by 1 serves as the actual reference metric.
Donation release profiles
We can now use the historical averages to shape the donation release profiles.
For the campaign we used the 30th, 50th and 80th percentiles as reference points. Between the 50th and 80th percentile, the donation amount gradually increases to 20% of the deposited funds. Beyond the 50th percentile, the acceleration is more pronounced, leading to a full 100% donation when the NDVI value falls at or below the 30th percentile.
Taking Kajiado, for example, the values 1.45, 1.47, and 1.51 correspond to the 30th, 50th, and 80th percentiles. In other words:
- 30% of the shifted average NDVIs are at or below 1.45. Looking at the average NDVI chart in the previous section, this holds true for the years 2017, 2021 and 2022 (2014 and 2016 are slightly above, not visible due to rounding), resulting in 100% of the deposited funds being donated.
- 50% of the shifted average NDVIs are at or below 1.47. This holds true for the years 2014, 2016, 2017, 2021, and 2022 (2013 is slightly above, not visible due to rounding), resulting in 20% of the deposited funds being donated.
- 80% of the shifted average NDVIs are at or below 1.51. This holds true for the years 2012-2022 except for 2019 and 2020, resulting in a non-zero donation amount. The only instances where a donation would not be triggered are the years 2019 and 2020.
A similar logic applies to Laikipia.
It's worth noting that commercial index-based insurance products typically employ a lower percentile (5-25%) as the trigger threshold. The beauty of conditional donations lies in their capacity for more generous payouts.
Note: We acknowledge that using simple averages leans towards pragmatism. In contrast, insurance companies may employ more sophisticated techniques to normalize the data - a consideration for future campaigns.
Join the cause
If you represent a charity or non-profit organization passionate about the concept of parametric conditional donations, reach out and join forces to provide more efficient and effective support to vulnerable communities worldwide. Given the versatile nature of DIVA Protocol, the donation payout can be linked to virtually any metric and the donation release profile can be tailored to reflect the specific needs and objectives.
About DIVA Donate
DIVA Donate is an innovative platform that leverages blockchain technology to enable parametric conditional donations. It is a joint initiative between three entities united around the mission of empowering vulnerable communities affected by climate change:
- Fortune Credit: a microfinance institution in Kenya which provides credit, insurance & other financial services to 50k+ customers including small-holder farmers & pastoralists,
- Shamba Network: an oracle which brings ecological/remotely-sensed data on-chain, and
- DIVA Technologies AG: developer of DIVA Protocol, a smart contract-based system for creating and managing custom derivative contracts peer-to-peer.
About Mercy Corps Ventures
Mercy Corps Ventures (MCV) invests in and catalyzes venture-led solutions to increase the resilience of underserved individuals and communities. Founded in 2015 as the impact investing arm of Mercy Corps, MCV supported 43 early-stage ventures to scale and raised over $396.7 million in follow-on funding. In September 2023, MCV announced a partnership with DIVA Donate to test anticipatory cash transfers to communities ahead of climate shocks leveraging blockchain technology.